AME Elite, KLK Land unveil RM1.3bil i-Park@Coalfields
From
/ 23/07/2026
(From left) Alfred, Kang, Tan, Wen Ling and Kok place their palms on the screen to triggering the opening sequence...
Read More
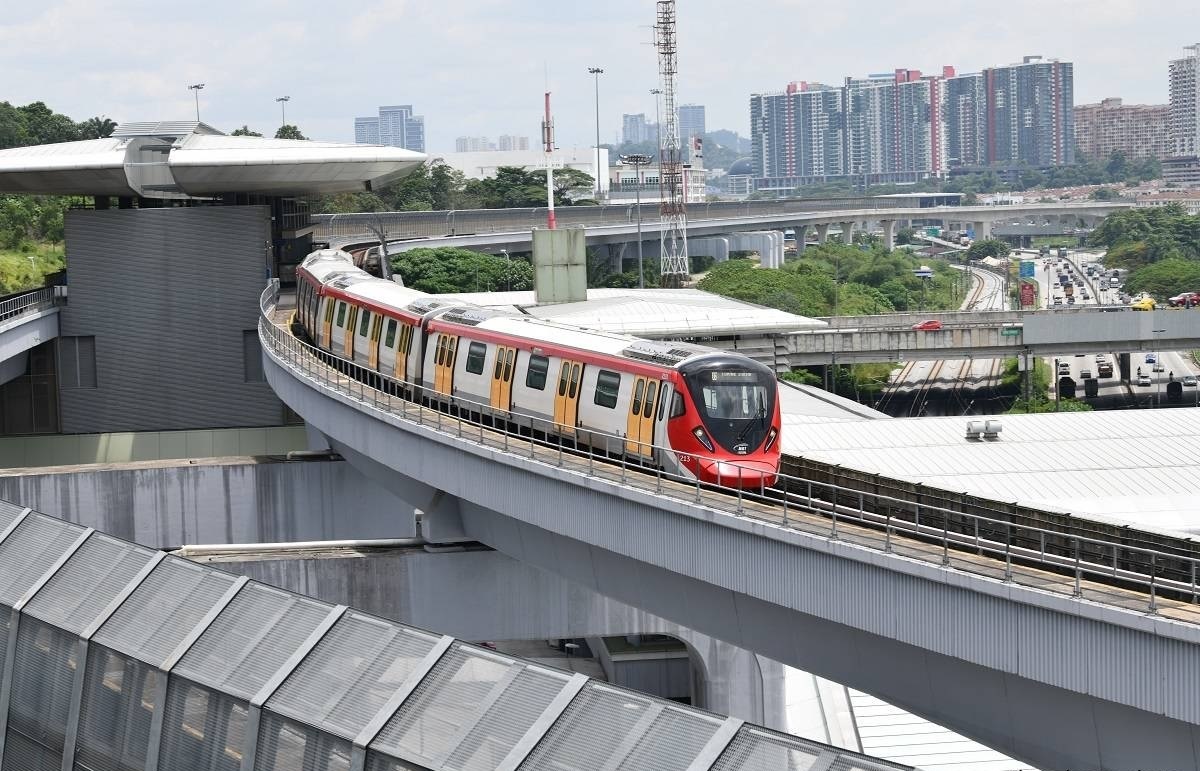
Largely viewed as an economic catalyst and the preferred mode of transportation, how much impact do MRT rail lines have on their surrounding properties? Using EdgeProp analysis tools, we give you data over the last two decades on transaction price and activity trends for investigation.
Accessibility to train transportation is becoming the new “location” in property buying. This is further driven by the awareness for greater sustainability, with modern track facilities seen as major drivers of higher efficiency in commuting and lower carbon footprint.
In the Klang Valley, the rail network received a boost in connectivity when the mass rapid transit (MRT) system was integrated into the existing KTM Komuter, light rail transit (LRT) and Monorail lines to offer seamless travel to most parts of the Greater Kuala Lumpur area.
While the first MRT Sungai Buloh-Kajang Line serves 31 stops, the MRT2 Putrajaya Line features 36 stations stretching from Kwasa Damansara to Putrajaya.
From the opening of MRT2’s first phase on June 16, 2022 to its full operation on March 16 last year, it was reported that the average daily weekday passenger trips had increased by 305%, from 23,000 to 93,000, said the Transport Ministry in a report by The Star in June 2023.
In another report in January this year, Loke said that Rapid Rail services, comprising the LRT, MRT and Monorail, achieved a daily ridership exceeding 800,000 passengers.
Meanwhile, the MRT3 Circle Line, with 33 proposed stations, is slated for completion in 2032, subject to land acquisition, according to the MRT Corp website. With an alignment that will run along the perimeter of the KL city, connecting to existing MRT, LRT, KTM Komuter, and KL Monorail lines through 10 interchange stations, it is set to be the final piece that completes the Klang Valley’s urban rail network.
Largely viewed as an economic catalyst and the preferred mode of transportation, how much impact do the proposed MRT train stations have on their surrounding properties? With transit orientation touted as a selling point for developments, especially high-rises, has data over the last decade proven that proximity to transit stations, particularly MRT stations, translates to higher demand for such strata projects?
Using EdgeProp analysis tools, we study if it is true that the closer a property is to a MRT station, the higher the value is.
Methodology
To keep within controlled variables, the study covers the price and transaction trends of only strata homes, which include all categories — from low-cost to luxury.
For the purpose of our analysis, the strata projects are split into four categories based on their distances from a transit station: 5 km. Only the impact of MRT stations is investigated, with the other rail lines excluded.
With data collected from EdgeProp, only “active” strata projects are included, which we define as a minimum of 10 transactions over a three-year period, to determine the rolling median of their prices. (Rental transactions are excluded in this analysis.)
A rolling median is used to exclude extreme values, and provide a more consistent yearly picture of the trends in prices and property activity.
Transactions from both the sub-sale and primary markets are taken into account.
Shorter distance equals higher value?
While there are increases across the board that coincide with MRT announcements and completions, they are not enough to conclude that they are directly caused by the MRT impact, because even sans the MRT factor, constant uptrends are also observed.
However, what is apparent from Chart 1 is the link between distance and price — the closer the properties are to MRTs, the higher the prices, except for the anomaly around 2020, when the above 5km category started overtaking the 3.01-5km marginally.
Active strata projects located less than 1.5km away from an MRT station consistently pose higher prices psf than those located further away, regardless of which MRT line was being announced or completed.
Nevertheless, there are some indications from Chart 1 that support the positive impacts of MRT on property values. Between 2009 and 2010, before the first MRT project was announced, prices for properties under the 3.01-5km and more than 5km distances saw significant descents from RM240 psf to RM164 psf (31.7% dive) and from RM162 psf to RM124 psf (23.5% drop) respectively.
However, from 2010 to 2011, both of these groups recorded upswings upon the announcements of MRT1 in June 2010 and the beginning of its construction in July 2011. Homes within the 3.01-5km range saw a positive growth from RM164 psf to RM175 psf (6.7%) while those more than 5km away rose from RM124 psf to RM140 psf (12.9%).
Similar patterns were observed between 2013 and 2014, when prices declined from RM221 to RM202 psf for the 3.01-5km (8.6%), and from RM167 to RM165 psf for more than 5km away (1.2%). Then, when MRT2 was announced in 2014, prices jumped to RM223 psf in 2015 for properties within 3.01-5km (10.4%) and to RM194 psf (17.6%) for properties more than 5km away.
The MRT effect showed up again when the MRT3 was announced on April 3, 2021. For properties within 1.5-3km, prices were falling from RM425 in 2020 to RM350 psf in 2021 (17.6%) before it climbed back up to RM369 psf in 2022 (5.4%).
This is also the case for properties within 3.01-5km, where prices were sliding from RM298 psf in 2020 to RM281 psf in 2021 (5.7%), before it inched up to RM293 psf in 2022 (4.3%).
Table 1 shows that although there were uptrends across the board when MRT projects were announced or completed, there was no clear correlation between the rate of price increase and distance.
For example, the biggest percentage increases in the first years following MRT developments were in fact consistently recorded by properties beyond 5km, except for 2022-2023 when MRT2 was completed. This could be attributed to the large number of properties that fall under the above 5km group, which basically covers all of KL and Selangor, including outliers like Sepang and Rawang.
In contrast, the smallest growth rates were invariably posed by the property group closest to MRTs. The only exception was when the first MRT line was announced, when the less than 1.5km group recorded its largest increase of 8.82% between 2010 and 2011.
A possible explanation for these unexceptional growth rates is the high selling prices. As observed in Chart 1, the properties nearest to the MRTs consistently posed the highest prices (RM517 psf in 2023), so the room for growth is limited to market affordability. Conversely, the more affordable prices (RM321 psf in 2023) of properties beyond 5km allow for greater trajectories.
Another interesting observation was the percentage increase for strata projects less than 1.5km kept shrinking with each subsequent MRT announcement, from 8.82% (MRT1) to 5.71% (MRT2) to 3.22% (MRT3). Similarly, upon operation of the lines, properties near MRT1 recorded a 3.02% increase, but only a 0,78% increase for MRT2.
Would more people want to buy my property if it’s closer to an MRT station?
In terms of overall market activity, Chart 2 reflects the general real estate market trends, which ascended steadily and reached its peak in 2017, before sloping downwards gradually and dipping from 2020 onwards because of the Covid-19 pandemic.
Notably, it shows a clear impact of MRT developments on transaction activity. The ratio of active strata projects across all the different distance categories remained fairly equal until 2010 when MRT1 was announced. Thereon, the correlation between distance and activity is markedly noticeable, where the closer the proximity, the higher the volume of active strata projects, with the less-than-1.5km category leading all the way.
As per our methodology, the number of active strata projects should be indicative of transaction volumes.
In 2010, when the MRT1 was first announced, we see a marked difference in the distribution of active projects based on their distance, with numbers increasing to 408 (34.2%) and 211 projects from 304 and 172 for the nearest and second nearest respectively. In comparison, projects within 3.01-5km fell to 90 from 136 while the furthest dived 57.6% to only 53 from 125.
The difference was even more evident upon MRT1’s completion in 2017, with the shortest distance topping at 752 projects (61.3%), followed by 346 for the next closest. In contrast, there were only 94 projects within 3.01-5km and 34 (2.8%) for more than 5km.
Similarly, pre-MRT2 announcement in 2013, active projects nearest to MRT jumped 25.1% from 597 to 747, while the 1.5-3km inched up to 306 from 301. On the other hand, the second furthest dropped from 139 to 79 and the furthest slumped by 75.5% from 98 to 24.
Upon MRT2’s completion in 2022, the proportions of active projects to distance were 672, 147, 41 and 28. This translates to differences of 75.7% and 3.15% between the nearest and furthest projects.
Even during the post-pandemic market decline between 2022 and 2023, projects less than 1.5km away recorded their highest increase in transactions of 15.6%, which coincided with the completion of MRT2.
Taking into account that transaction prices for the same periods showed uptrends (Chart 1), which indicate higher demand, the decreased numbers in active strata projects could be due to lower supply of projects and units or other factors beyond the scope of this analysis.
Looking to buy a home? Sign up for EdgeProp START and get exclusive rewards and vouchers for ANY home purchase in Malaysia (primary or subsale)!
Source: EdgeProp.my


POST YOUR COMMENTS